Chapter 4 – Administration
ping
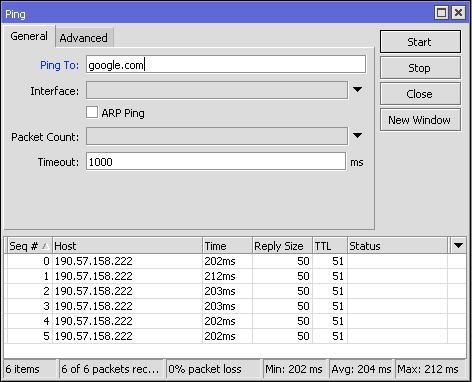
It is a basic connectivity tool that uses ICMP Echo messages to determine whether a remote host is up or down, and also to determine the round trip delay when communicating with that remote host.
The ping tool sends an ICMP (type 8) message to the remote host and waits for the return ICMP echo-reply (type 0) message. The interval between these events is known as a “round trip.”
If the response (known as a “pong”) does not arrive until the timeout interval expires, it is assumed to be timed-out.
Another significant parameter reported in the ping tool is ttl (Time To Live), which decreases on each machine on which the packet is processed. The packet will reach its destination only when the ttl is greater than the number of routers between the source and the destination.
How to use a Ping
In the WinBox Terminal window, we can use it to perform a ping
/ping www.mikrotik.com
HOST SIZE TTL TIME STATUS
159.148.147.196 56 50 163ms
159.148.147.196 56 50 156ms
159.148.147.196 56 50 156ms
159.148.147.196 56 50 160ms
Sent=4 received=4 packet-loss=0% min-rtt=156ms avg-rtt=158ms
Other Ping Examples
/ping 10.1.101.3
HOST SIZE TTL TIME STATUS
10.1.101.3 56 64 3ms
10.1.101.3 56 64 10ms
10.1.101.3 56 64 7ms
sent=3 received=3 packet-loss=0% min-rtt=3ms avg-rtt=6ms max-rtt=10ms
/ping 10.1.101.9
HOST SIZE TTL TIME STATUS
timeout
timeout
timeout
sent=3 received=0 packet-loss=100%
traceroute
Traceroute is a network diagnostic tool that displays the path and measures the transit delay of packets through an IP network.
The path history is recorded as the round-trip time of packets received from each successive host (remote node) on the path. The sum of the average times in each hop indicates the total time taken to establish the connection.
Traceroute proceeds unless all packets (3 packets) that are sent are lost more than twice, then the connection is lost and the route can no longer be evaluated. On the other hand, ping only calculates the final round trip times from the destination point.
Traceroute sends a sequence of UDP (User Datagram Protocol) packets addressed to the destination host. You can also use ICMP Echo Request packets, or TCP SYN packets.
The TTL value is used to determine the intermediate routers that are being traversed until reaching the destination. Routers decrement the TTL values of packets by one and discard packets whose TTL values are zero.
When a router receives a packet with ttl=0, it sends back an ICMP error message indicating ICMP Time Exceeded.
The return timestamp values from each router along the path are the delay (latency) values. This value is usually measured in milliseconds for each packet.
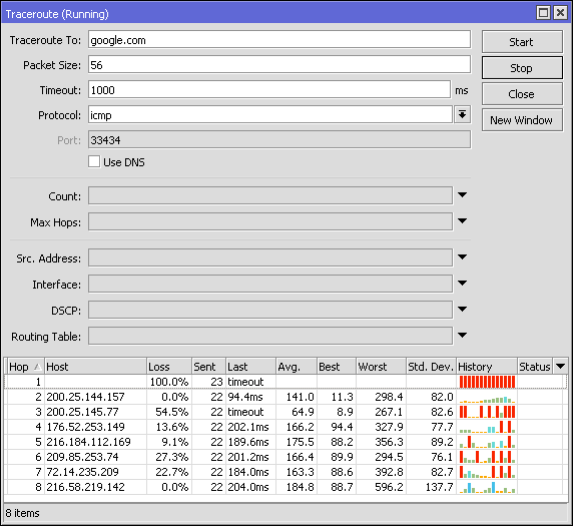
/tool traceroute www.mikrotik.com
# ADDRESS LOSS SENT LAST AVG BEST WORST STD-DEV STATUS
100% 3 timeout
216.113.124.190 0% 3 13.9ms 12.2 11.1 13.9 1.2
The sender waits for a response within a specified number of seconds. If a packet is not recognized within the expected range, an asterisk (*) is displayed. The IP protocol does not require packets to take the same route to a particular destination, so the hosts shown could be hosts that other packets have traversed. If the host at hop #N does not respond, the hop is skipped in the output.
More information: https://en.wikipedia.org/wiki/Traceroute
Interface Traffic Monitor
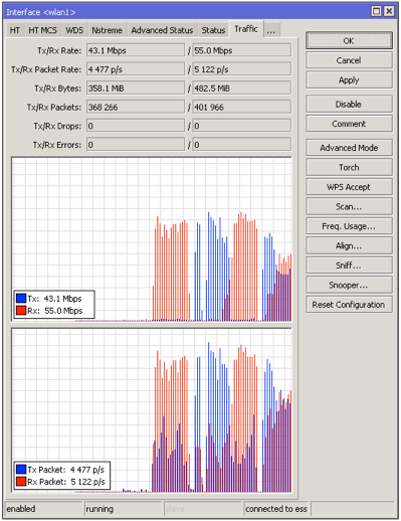
Traffic passes through any interface and can thus be monitored
/interface monitor-traffic [id | yam]
Features
- Real-time traffic status
- Available for each interface in the traffic tab
- It can also be monitored from WebFig and the CLI
Example
Monitor ether2 and aggregate traffic. Aggregate is used to control the total amount of traffic handled by the router.
/interface monitor-traffic ether2,aggregate
  rx-packets-per-second: 9 14
    rx-drops-per-second: 0 0
   rx-errors-per-second: 0 0
     rx-bits-per-second: 6.6kbps 10.2kbps
  tx-packets-per-second: 9 12
    tx-drops-per-second: 0 0
   tx-errors-per-second: 0 0
     tx-bits-per-second: 13.6kbps 15.8kbps
Torch
The Torch is a real-time traffic monitoring tool that can be used to monitor traffic through an interface.
You can monitor traffic classified by protocol name, source address, destination address, port. The tool torch shows the protocol that has been chosen and the data rate tx/rx from each of them.
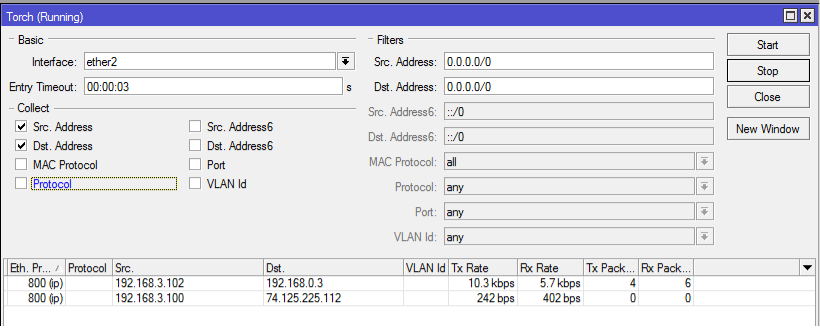
The following example monitors the traffic generated by the telnet protocol, which passes through the ether1 interface:
/tool torch ether1 port=telnet
SRC-PORT DST-PORT TX RX
1439 23 (telnet) 1.7kbps 368bps
To see what protocols are sent over ether1:
/tool torch ether1 protocol=any-ip
PRO.. TX RX
tcp 1.06kbps 608bps
udp 896bps 3.7kbps
icmp 480bps 480bps
ospf 0bps. 192bps
To see what protocols are bound to host 10.0.0.144/32 connected to interface ether1:
/tool torch ether1 src-address=10.0.0.144/32 protocol=any
PRO.. SRC-ADDRESS TX RX
tcp 10.0.0.144 1.01kbps 608bps
icmp 10.0.0.144 480bps 480bps
Graphing
It is a tool to monitor various RouterOS parameters over time and puts the collected data into graphs.
This tool can display graphs of:
- RouterBOARD health status (voltage and temperature)
- Resource utilization (CPU, memory and disk utilization)
- Traffic passing through interfaces
- Traffic passing through simple queues
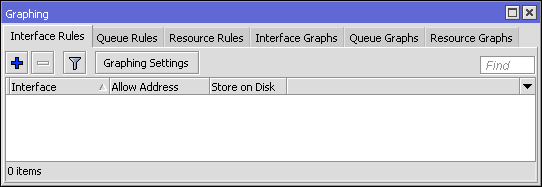
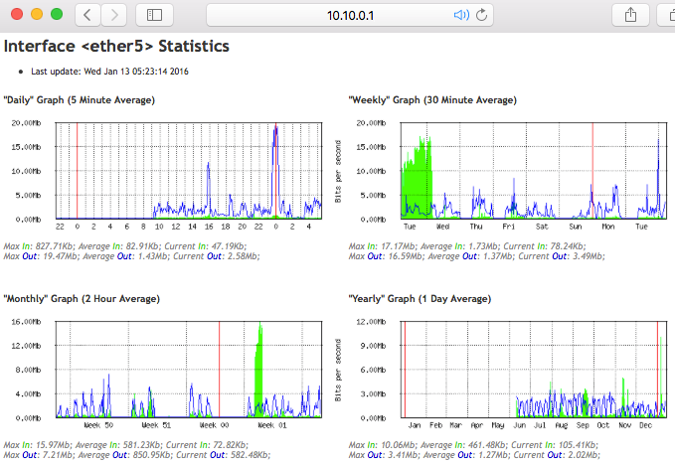
Graphing consists of two parts:
- The first part collects information
- The second part displays the data on a web page
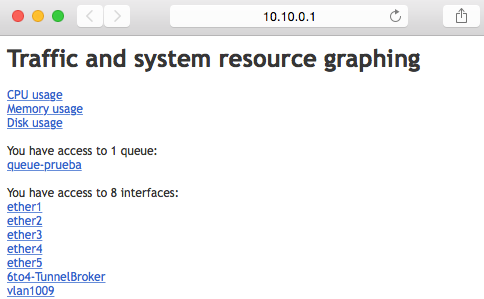
To access the graphics, you must type in the web browser http://[Direccion_IP_Router]/graphs/ and then choose the graph you want to view.
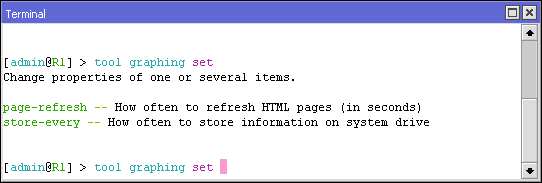
/tool graphing
- store-every (24hours | 5min | hour; Default: 5min) – How frequently the collected data is written to the system drive
- page-refresh (integer | never; Default: 300) – How often the graphics page is refreshed

Interface Graphing
/tool graphing interface
This option allows you to configure in which interface the graphs will collect bandwidth usage data.

Properties
- allow-address (IP/IPv6 prefix; Default: 0.0.0.0/0) – IP address range from which access to graphics information is allowed
- how to (string; Default: ) – Description of the current entry
- disabled (yes | no; Default: no) – Defines whether the item is used
- interface (all | interface name; Default: all) – Defines which interfaces will be monitored. all means that all interfaces will be monitored.
- store-on-disk (yes | no; Default: yes) – Defines whether the collected information will be recorded on the system drive.
Simple Queue Graphing
/tool graphing queue
This option allows you to configure in which simple queue the graphs will collect bandwidth usage data.

Properties
- allow-address (IP/IPv6 prefix; Default: 0.0.0.0/0) – IP address range from which access to graphics information is allowed
- allow-target (yes | no; Default: yes) – Defines whether to allow access to charts from the queue target address
- how to (string; Default: ) – Description of the current entry
- disabled (yes | no; Default: no) – Defines whether the item is used
- simple-queue (all | queue name; Default: all) – Defines which queues will be monitored. all means that all queues will be monitored.
- store-on-disk (yes | no; Default: yes) – Defines whether the collected information will be recorded on the system drive.
Important: If the simple queue has a target-address=0.0.0.0/0 then everyone will be enabled to access the queue's graphs even if the allowed address is set to a specific address. This happens because the default queue graphs are also accessible from the target address.
Resource Graphs
/tool graphing resource
This option allows you to enable system resource graphs.

Graphing collects data from:
- CPU usage
- Memory Usage
- Disk Usage
Properties
- allow-address (IP/IPv6 prefix; Default: 0.0.0.0/0) – IP address range from which access to graphics information is allowed
- how to (string; Default: ) – Description of the current entry
- disabled (yes | no; Default: no) – Defines whether the item is used
- store-on-disk (yes | no; Default: yes) – Defines whether the collected information will be recorded on the system drive.
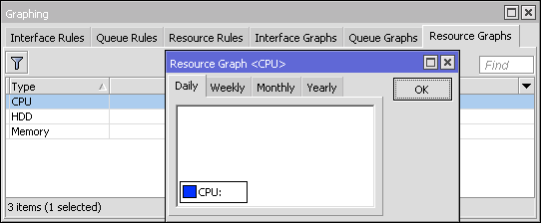
WinBox allows you to view the same data collected as on the web page. You must open the window in Tools/Graphing. Then you must double-click on what you want to see the graphs
Contact MikroTik Support
Supout.rif
The support file is used to debug MikroTik RouterOS and to resolve support questions faster. All information on the MikroTik Router is saved in a binary file, which is stored on the router and can be downloaded from the router via ftp.
You can review the content of this file in your MikroTik account, simply go to the Supout.rif section and upload the file.
This file (supout.rif) contains the router configuration, logs and other details that will help the MikroTik support group to resolve your issue.
Syntax
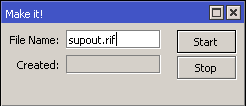
We do it with the following command in “Terminal”
/system sup-output
Created: 14%
--[Q quit|D dump|Cz pause]

/system sup-output
Created: 100%
--[Q quit|D dump|Cz pause]
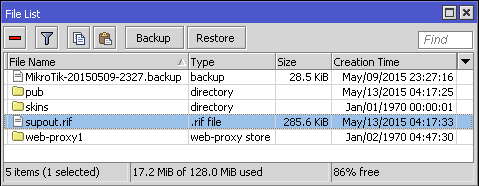
Once the upload is 100% complete we will be able to see the file in “Files”
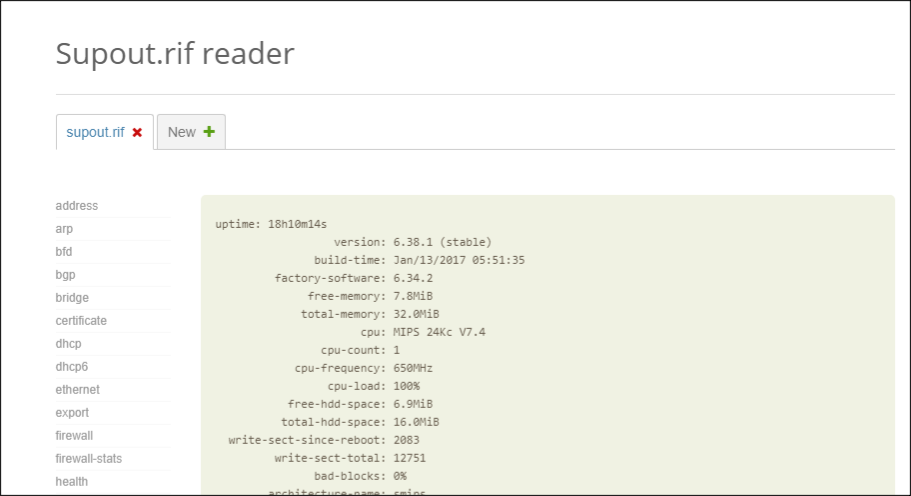
Supout.rif Viewer
To access the Supout.rif Viewer You just have to access your Mikrotik account. You must have an account (it's a good idea to have one anyway)

The first step is to locate and upload the file you generated
Autosupout.rif
- A file can be generated automatically in case of software failure (ex. Kernel Panic or system stops responding for one minute.)
- Done through the control body (system)
System logs and debug logs
RouterOS is capable of logging various system events and status information. The logs can be saved in the routers RAM, on a disk, in a file, sent by email or even sent to a remote system log server. The latter is known as syslog and is in accordance with RFC 3164.
Syslog runs over UDP 514
/ log
All messages stored in the router's local memory can be printed from the /log menu. Each entry contains the date and time when the event occurred, the topics that belong to this message, and the message itself.
If the logs are displayed on the same date that the log entry is added, then only the time will be displayed.
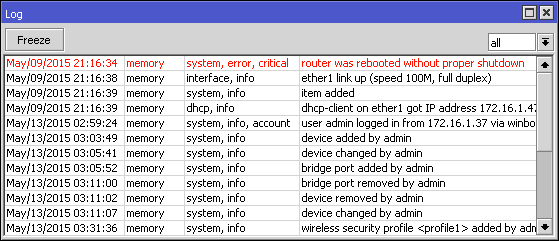
In the following example the command will display all messages where one of the topics is info and will detect new entries until Ctrl+C is pressed
/log print follow where topics~".info"
12:52:24 script,info hello from script
-- Ctrl-C to quit.
When using print you can use follow mode. This will cause a separator to be inserted every time the space bar is pressed on the keyboard.
/log print follow where topics~".info"
12:52:24 script,info hello from script

= = = = = = = = = = = = = = = = = = = = = = = = = = =

-- Ctrl-C to quit.
Logging Configuration
/system log
- action (name; Default: memory) – Specifies one of the system's default actions, or the actions specified by the user in the actions menu
- prefix (string; Default: ) – Prefix that can be added to the beginning of log messages
- topics (account, async, backup, bgp, calc, critical, ddns, debug, dhcp, e-mail, error, event, firewall, gsm, hotspot, igmp-proxy, info, ipsec, iscsi, isdn, l2tp, ldp, manager , mme, mpls, ntp, ospf, ovpn, packet, pim, ppp, pppoe, pptp, radius, radvd, raw, read, rip, route, rsvp, script, sertcp, state, store, system, telephony, tftp, timer , ups, warning, watchdog, web-proxy, wireless, write; Default: info) – Logs all messages that fall into the specified topic or topic list. You can use the character “!” before the topic to exclude messages that fall under that topic. The sign "!" It is logical negation. For example, if you want to log NTP events but without much detail you can write /system logging add topics=ntp,debug,!packet
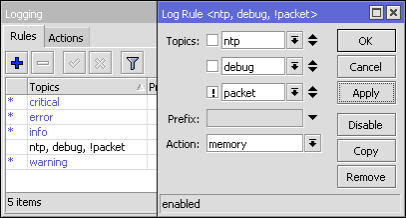
Actions
/system logging action
- bsd-syslog (yes|no; Default: ) – Specifies whether to use bsd-syslog as defined in RFC-3164
- disk-file-count (integer [1..65535]; Default: 2) – Specifies the number of files that will be used to save log messages. Applies only if action=disk
- disk-file-name (string; Default: log) – Name of the file that will be used to save log messages. Applies only if action=disk
- disk-lines-per-file (integer [1..65535]; Default: 100) – Specifies the maximum file size in number of lines. Applies only if action=disk
- disk-stop-on-full (yes|no; Default: no) – Specifies whether to stop writing log messages to disk after the values specified in disk-lines-per-file and disk-file-count have been reached. Applies only if action=disk
- email-to (string; Default: ) – Email address where the records will be sent. Applies only if action=email
- memory-lines (integer [1..65535]; Default: 100) – Specifies the number of records in the local memory buffer. Applies only if action=memory
- memory-stop-on-full (yes|no; Default: no) – Specifies whether to stop writing log messages to memory after the values specified in memory-lines have been reached. Applies only if action=memory
- name (string; Default: ) – Name of the action (action)
- remember (yes|no; Default: ) – Specifies whether to keep log messages that have not yet been displayed in the console. Applies only if action=echo
- remote (IP/IPv6 Address[:Port]; Default: 0.0.0.0:514) – Specifies the IP/IPv6 address of the remote syslog server and the UDP port number. Applies only if action=remote
- src-address (IP address; Default: 0.0.0.0) – Source address used when sending packets to the remote server
- syslog-facility (auth, authpriv, cron, daemon, ftp, kern, local0, local1, local2, local3, local4, local5, local6, local7, lpr, mail, news, ntp, syslog, user, uucp; Default: daemon)
- syslog-severity (alert, auto, critical, debug, emergency, error, info, notice, warning; Default: auto) – Severity indicator level defined in RFC-3164:
- Emergency: system is unusable
- Alert: action must be taken immediately
- Critical: critical conditions
- Error: error conditions
- Warning: warning conditions
- notice: normal but significant condition
- informational: informational messages
- Debug: debug-level messages
- target (disk, echo, email, memory, remote; Default: memory) – Storage facility or destination for log messages (log)
- Disks – logs are saved to the hard drive
- threw out – logs are displayed on the console screen
- Email – logs are sent by email
- memory – logs are stored in local memory buffer
- remote – logs are sent to remote host
Important: Default actions cannot be deleted or renamed

Topics
Each log entry has a topic that describes the origin of the log message. Therefore there may be more than one topic assigned to said log message. For example, OSPF purges records that have 4 different topics: route, ospf, debug and raw.
11:11:43 route,ospf,debug SEND: Hello Packet 10.255.255.1 -> 224.0.0.5 on lo0
11:11:43 route,ospf,debug,raw PACKET:
11:11:43 route,ospf,debug,raw 02 01 00 2C 0A FF FF 03 00 00 00 00 E7 9B 00 00
11:11:43 route,ospf,debug,raw 00 00 00 00 00 00 00 00 FF FF FF FF 00 0A 02 01
11:11:43 route,ospf,debug,raw 00 00 00 28 0A FF FF 01 00 00 00 00
List of options independent of topics:
- critical – Log entries marked as critical. These log entries are displayed in the console every time the user logs in.
- debugging – Purge registry entries
- error – Error messages
- info – Informative log entry
- packet – Log entry showing the contents of packets sent/received
- raw – Log entry showing raw content of sent/received packets
- warning - Warning message.
Topics used by various RouterOS features
- account – Records the messages generated by the accounting option
- async – Records messages generated by asynchronous devices
- backup – Records the messages generated by the backup creation option
- bfd – Records the messages generated by the Routing/BFD protocol
- bgp – Records messages generated by the Routing/BGP protocol
- tracing – Records route calculation messages
- dns – Logs messages generated by the Tools/Dynamic DNS tool
- dhcp – Records messages generated by the DHCP client, server and relay
- e-mail – Records messages generated by the Tools/email tool
- event – Records the messages generated by the routing event. For example, when a new route has been installed in the routing table.
- Firewall – Logs messages generated by the firewall when action=log is set
- Mob – Records messages generated by GSM devices
- hotspot – Logs HotSpot related messages
- igmp-proxy – Records messages generated with IGMP Proxy
- ipsec – IpSec log entries
- iscsi
- isdn
- l2tp – Records messages generated by Interface/L2TP client and server
- ldp – Records messages generated by the MPLS/LDP protocol
- manager – Records messages generated by User Manager
- mme – MME routing protocol messages
- mpls – MPLS messages
- Ntp – Records messages generated by the sNTP client
- ospf – Records messages generated by the Routing/OSPF routing protocol
- ovpn – Records messages generated by the OpenVPN tunnel
- Pim – Records the messages generated by Multicast PIM-SM
- ppp – Records messages generated by the ppp option
- pppoe – Logs messages generated by PPPoE server/client
- pptp – Logs messages generated by PPTP server/client
- radius – Logs messages generated by RADIUS Client
- radvd – Logs messages generated by the IPv6 radv deamon
- read – SMS tool messages
- rip – RIP routing protocol messages
- road. – Records the messages generated by the routing option
- rsvp – Messages generated by the Resource Reservation Protocol
- script – Records messages generated by scripts
- sertcp – Logs messages related to the option responsible for /ports remote-access
simulator - state – Routing and DHCP client status messages
- store – Records the messages generated by the store option
- system – Generic system messages
telephony - tftp – Messages generated by the TFTP server
- timer – Records messages related to the timers used in RouterOS. For example logs
- keepalive bgp
12:41:40 route,bgp,debug,timer KeepaliveTimer expired
12:41:40 route,bgp,debug,timer RemoteAddress=2001:470:1f09:131::1
- ups – Messages generated by UPS monitoring tools
- watchdog – Records messages generated by watchdog
- web-proxy – Records messages generated by web proxy
- wireless – Records messages generated by Interface/Wireless
- write – SMS tool messages
Additional resources
Wiki
https://wiki.mikrotik.com/wiki/Manual:TOC
New documentation in the following link: https://help.mikrotik.com/docs/
- Here you will find information about RouterOS
- All RouterOS commands
- Explanation
- Syntax
- Examples
- Additional tips and tricks
YouTube
https://www.youtube.com/user/mikrotikrouter
- Video resources on various topics
Discussion Forums
- Moderated by MikroTik staff
- It is a forum for discussions on various topics
- A lot of information can be found here
- You can find a solution to your problem
MikroTik Support
- E-Mail: [email protected]
- Instructions for requesting support: https://www.mikrotik.com/support.html
- Mikrotik's support if the router was purchased from the factory is:
- 15 days (license level 4)
- 30 days (Level 5 License and Level 6)
Distributors/Support
- The wholesale distributor/reseller will provide support as long as the router was purchased from them.
- Certified Consultants can be hired for special needs
- https://www.mikrotik.com/consultants
- Share this Article


