

No Courses Found!
Global vision of ethical hacking and penetration testing
Global vision of ethical hacking and penetration testing
Information Security Regulations How to implement?
Introduction to Data Science with Python
Global vision of ethical hacking and penetration testing
Information Security Regulations How to implement?
How to properly manage multiple public or private IPs on the edge router
Ways to assign public IP addresses to clients with MikroTik
Guide to configuring Internet egress routes with two or more providers (failover, balancing and recursion)
Filter implementation strategies to restrict access to web pages with MikroTik
Guide for Firewall configuration in MikroTik RouterOS
Filtering threats: Firewall rules to protect the router from common network attacks
Practical solutions to optimize network infrastructure: Subnetting strategies, Routing and NAT troubleshooting
BGP as a routing protocol to advertise IPv4 resources to the Internet
Forms of Delivery and Implementation of IPv6 in ISP Environments
BGP as an Internal routing protocol in a routed network
OSPF as an Internal routing protocol in a routed network
Guide to start our first IPv6 Firewall
Guide to building an Advanced Firewall in IPv6
Wireguard in MikroTik RouterOS v7
OSPFv3 Internal routing protocol
BGP over IPv6 as a routing protocol to advertise IPv6 resources to the Internet
Implementation of mark-connection and mark-packet for QoS
Simple Queues in MikroTik RouterOS v7
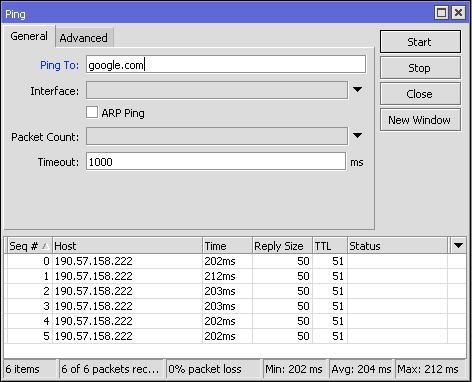
It is a basic connectivity tool that uses ICMP Echo messages to determine whether a remote host is up or down, and also to determine the round trip delay when communicating with that remote host.
The ping tool sends an ICMP (type 8) message to the remote host and waits for the return ICMP echo-reply (type 0) message. The interval between these events is known as a “round trip.”
If the response (known as a “pong”) does not arrive until the timeout interval expires, it is assumed to be timed-out.
Another significant parameter reported in the ping tool is ttl (Time To Live), which decreases on each machine on which the packet is processed. The packet will reach its destination only when the ttl is greater than the number of routers between the source and the destination.
How to use a Ping
In the WinBox Terminal window, we can use it to perform a ping
/ping www.mikrotik.com
HOST SIZE TTL TIME STATUS
159.148.147.196 56 50 163ms
159.148.147.196 56 50 156ms
159.148.147.196 56 50 156ms
159.148.147.196 56 50 160ms
Sent=4 received=4 packet-loss=0% min-rtt=156ms avg-rtt=158ms
Other Ping Examples
/ping 10.1.101.3
HOST SIZE TTL TIME STATUS
10.1.101.3 56 64 3ms
10.1.101.3 56 64 10ms
10.1.101.3 56 64 7ms
sent=3 received=3 packet-loss=0% min-rtt=3ms avg-rtt=6ms max-rtt=10ms
/ping 10.1.101.9
HOST SIZE TTL TIME STATUS
timeout
timeout
timeout
sent=3 received=0 packet-loss=100%
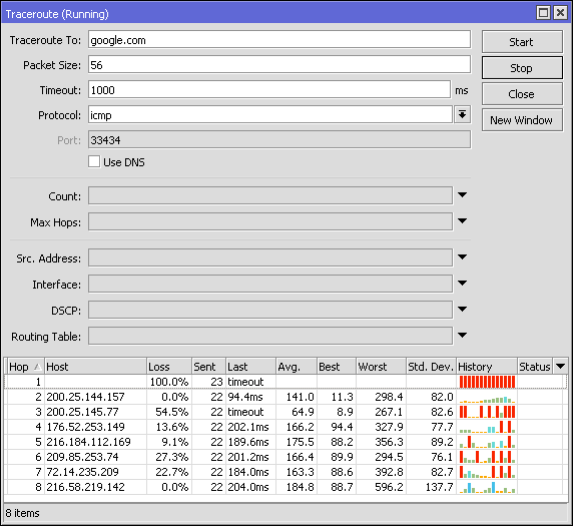
Traceroute is a network diagnostic tool that displays the path and measures the transit delay of packets through an IP network.
The path history is recorded as the round-trip time of packets received from each successive host (remote node) on the path. The sum of the average times in each hop indicates the total time taken to establish the connection.
Traceroute proceeds unless all packets (3 packets) that are sent are lost more than twice, then the connection is lost and the route can no longer be evaluated. On the other hand, ping only calculates the final round trip times from the destination point.
Traceroute sends a sequence of UDP (User Datagram Protocol) packets addressed to the destination host. You can also use ICMP Echo Request packets, or TCP SYN packets.
The TTL value is used to determine the intermediate routers that are being traversed until reaching the destination. Routers decrement the TTL values of packets by one and discard packets whose TTL values are zero.
When a router receives a packet with ttl=0, it sends back an ICMP error message indicating ICMP Time Exceeded.
The return timestamp values from each router along the path are the delay (latency) values. This value is usually measured in milliseconds for each packet.
/tool traceroute www.mikrotik.com
# ADDRESS LOSS SENT LAST AVG BEST WORST STD-DEV STATUS
100% 3 timeout
216.113.124.190 0% 3 13.9ms 12.2 11.1 13.9 1.2
The sender waits for a response within a specified number of seconds. If a packet is not recognized within the expected range, an asterisk (*) is displayed. The IP protocol does not require packets to take the same route to a particular destination, so the hosts shown could be hosts that other packets have traversed. If the host at hop #N does not respond, the hop is skipped in the output.
More information: https://en.wikipedia.org/wiki/Traceroute
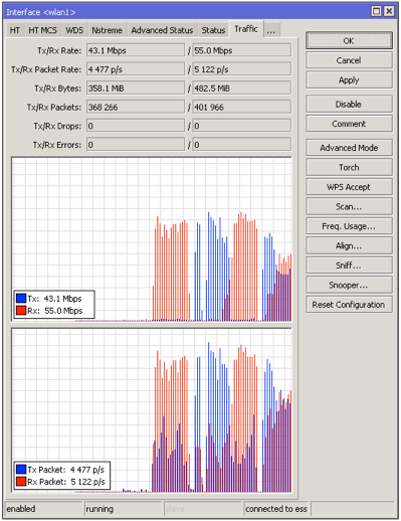
Traffic passes through any interface and can thus be monitored
/interface monitor-traffic [id | yam]
Features
Example
Monitor ether2 and aggregate traffic. Aggregate is used to control the total amount of traffic handled by the router.
/interface monitor-traffic ether2,aggregate
  rx-packets-per-second: 9 14
    rx-drops-per-second: 0 0
   rx-errors-per-second: 0 0
     rx-bits-per-second: 6.6kbps 10.2kbps
  tx-packets-per-second: 9 12
    tx-drops-per-second: 0 0
   tx-errors-per-second: 0 0
     tx-bits-per-second: 13.6kbps 15.8kbps
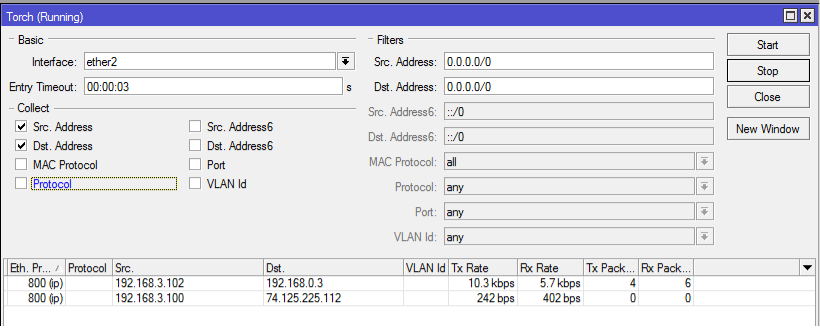
The Torch is a real-time traffic monitoring tool that can be used to monitor traffic through an interface.
You can monitor traffic classified by protocol name, source address, destination address, port. The tool torch shows the protocol that has been chosen and the data rate tx/rx from each of them.
The following example monitors the traffic generated by the telnet protocol, which passes through the ether1 interface:
/tool torch ether1 port=telnet
SRC-PORT DST-PORT TX RX
1439 23 (telnet) 1.7kbps 368bps
To see what protocols are sent over ether1:
/tool torch ether1 protocol=any-ip
PRO.. TX RX
tcp 1.06kbps 608bps
udp 896bps 3.7kbps
icmp 480bps 480bps
ospf 0bps. 192bps
To see what protocols are bound to host 10.0.0.144/32 connected to interface ether1:
/tool torch ether1 src-address=10.0.0.144/32 protocol=any
PRO.. SRC-ADDRESS TX RX
tcp 10.0.0.144 1.01kbps 608bps
icmp 10.0.0.144 480bps 480bps
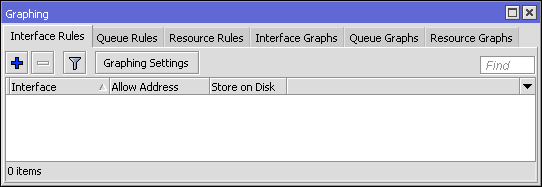
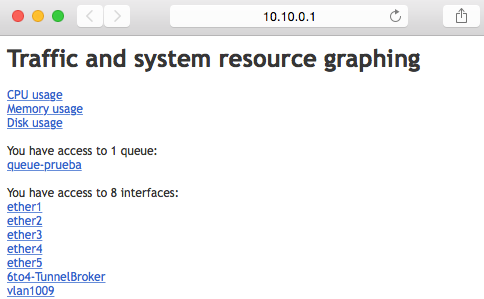
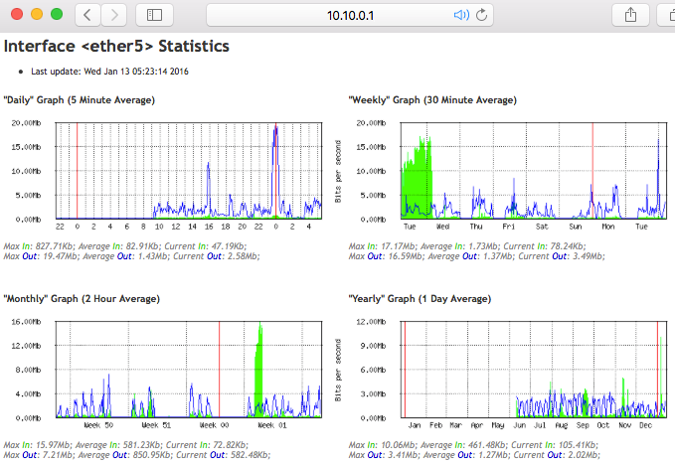
It is a tool to monitor various RouterOS parameters over time and puts the collected data into graphs.
This tool can display graphs of:
Graphing consists of two parts:
To access the graphics, you must type in the web browser http://[Direccion_IP_Router]/graphs/ and then choose the graph you want to view.
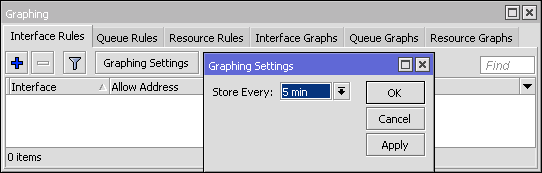
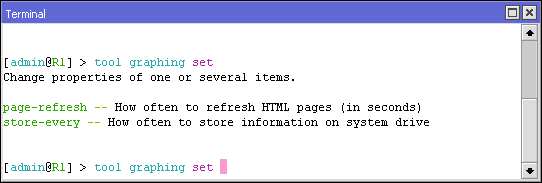
/tool graphing
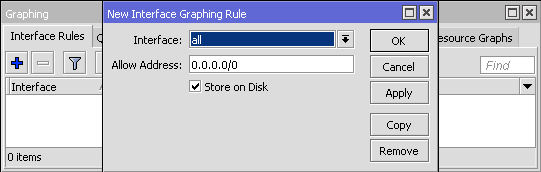
/tool graphing interface
This option allows you to configure in which interface the graphs will collect bandwidth usage data.
Properties
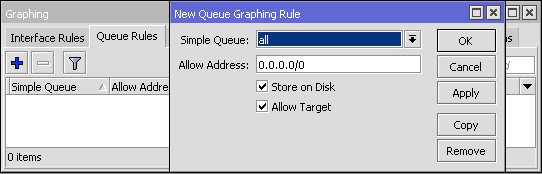
/tool graphing queue
This option allows you to configure in which simple queue the graphs will collect bandwidth usage data.
Properties
Important: If the simple queue has a target-address=0.0.0.0/0 then everyone will be enabled to access the queue's graphs even if the allowed address is set to a specific address. This happens because the default queue graphs are also accessible from the target address.
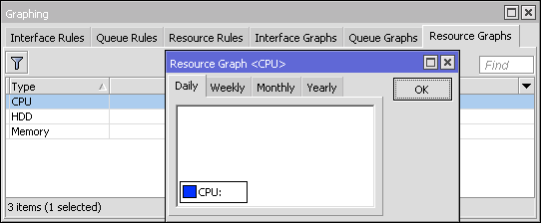
/tool graphing resource
This option allows you to enable system resource graphs.
Graphing collects data from:
Properties
WinBox allows you to view the same data collected as on the web page. You must open the window in Tools/Graphing. Then you must double-click on what you want to see the graphs
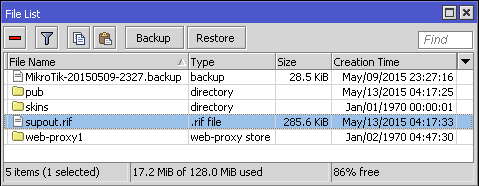
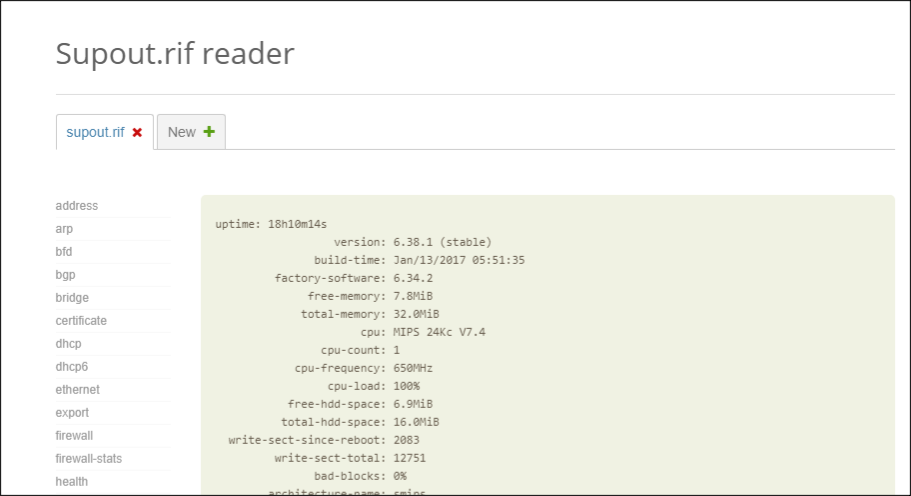
The support file is used to debug MikroTik RouterOS and to resolve support questions faster. All information on the MikroTik Router is saved in a binary file, which is stored on the router and can be downloaded from the router via ftp.
You can review the content of this file in your MikroTik account, simply go to the Supout.rif section and upload the file.
This file (supout.rif) contains the router configuration, logs and other details that will help the MikroTik support group to resolve your issue.
Syntax
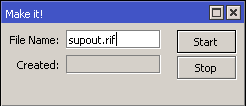
We do it with the following command in “Terminal”
/system sup-output
Created: 14%
--[Q quit|D dump|Cz pause]

/system sup-output
Created: 100%
--[Q quit|D dump|Cz pause]
Once the upload is 100% complete we will be able to see the file in “Files”
To access the Supout.rif Viewer You just have to access your Mikrotik account. You must have an account (it's a good idea to have one anyway)
The first step is to locate and upload the file you generated
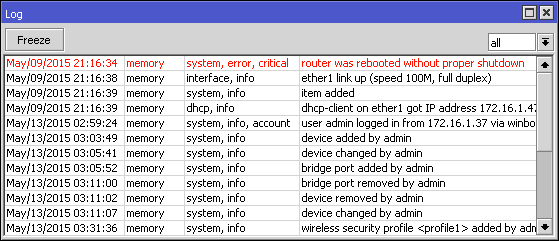
RouterOS is capable of logging various system events and status information. The logs can be saved in the routers RAM, on a disk, in a file, sent by email or even sent to a remote system log server. The latter is known as syslog and is in accordance with RFC 3164.
Syslog runs over UDP 514
/ log
All messages stored in the router's local memory can be printed from the /log menu. Each entry contains the date and time when the event occurred, the topics that belong to this message, and the message itself.
If the logs are displayed on the same date that the log entry is added, then only the time will be displayed.
In the following example the command will display all messages where one of the topics is info and will detect new entries until Ctrl+C is pressed
/log print follow where topics~".info"
12:52:24 script,info hello from script
-- Ctrl-C to quit.
When using print you can use follow mode. This will cause a separator to be inserted every time the space bar is pressed on the keyboard.
/log print follow where topics~".info"
12:52:24 script,info hello from script

= = = = = = = = = = = = = = = = = = = = = = = = = = =

-- Ctrl-C to quit.
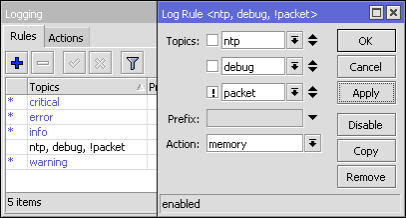
/system log
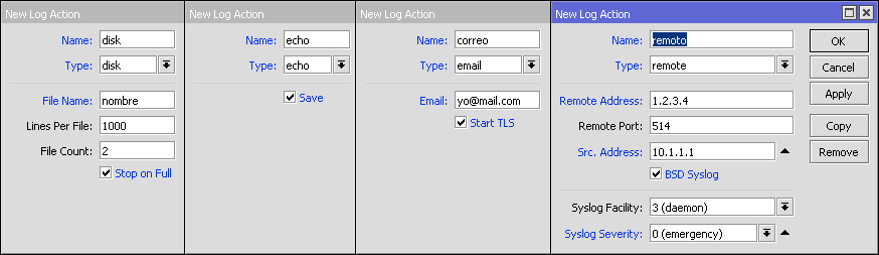
/system logging action
Important: Default actions cannot be deleted or renamed
Each log entry has a topic that describes the origin of the log message. Therefore there may be more than one topic assigned to said log message. For example, OSPF purges records that have 4 different topics: route, ospf, debug and raw.
11:11:43 route,ospf,debug SEND: Hello Packet 10.255.255.1 -> 224.0.0.5 on lo0
11:11:43 route,ospf,debug,raw PACKET:
11:11:43 route,ospf,debug,raw 02 01 00 2C 0A FF FF 03 00 00 00 00 E7 9B 00 00
11:11:43 route,ospf,debug,raw 00 00 00 00 00 00 00 00 FF FF FF FF 00 0A 02 01
11:11:43 route,ospf,debug,raw 00 00 00 28 0A FF FF 01 00 00 00 00
List of options independent of topics:
Topics used by various RouterOS features
12:41:40 route,bgp,debug,timer KeepaliveTimer expired
12:41:40 route,bgp,debug,timer RemoteAddress=2001:470:1f09:131::1
Wiki
https://wiki.mikrotik.com/wiki/Manual:TOC
New documentation in the following link: https://help.mikrotik.com/docs/
YouTube
https://www.youtube.com/user/mikrotikrouter
Discussion Forums
MikroTik Support
Distributors/Support
Av. Juan T. Marengo and J. Orrantia
Professional Center Building, Office 507
Guayaquil. Ecuador
Zip Code 090505
to our weekly newsletters
Copyright © 2024 abcxperts.com – All Rights Reserved
40% discount on MikroTik books and book packs - Discount Code: AN24-LIB Discard
Take advantage of the Three Kings Day discount code!
Take advantage of the New Year's Eve discount code!
Take advantage of the discount code for Christmas!!!
all MikroTik OnLine courses
all Academy courses
all MikroTik Books and Book Packs
Take advantage of the discount codes for Cyber Week!!!
all MikroTik OnLine courses
all Academy courses
all MikroTik Books and Book Packs
Take advantage of the discount codes for Black Friday!!!
**Codes are applied in the shopping cart
Take advantage of discount codes for Halloween.
Codes are applied in the shopping cart

11% discount on all MikroTik OnLine courses
11%

30% discount on all Academy courses
30%

25% discount on all MikroTik Books and Book Packs
25%