No Courses Found!
- Books
Books (eBooks) MikroTik in Spanish

MikroTik eBooks in English
- Courses
- NAS (Network Administration Specialist) Series
- UAS Series (Ubiquiti Administration Specialist)
- (UAS-UNI-PDE) Planning and Deployment of WiFi Networks
- (UAS-UNI-CAD) Configuration and Administration of Ubiquiti UniFi WiFi Networks
- (UAS-AIR-FPD) Fundamentals, planning and deployment of radio links
- (UAS-AIR-CPM) Configuration of Point-to-Point and Point-Multipoint links
- (UAS-AIR-INT) Introduction to Ubiquiti airMAX
- MAS Series (MikroTik Administration Specialist)
- NAE (Network Administration Engineer) Series
- MAE (MikroTik Administration Engineer) Series
- Verify Certificate
Academy Xperts OnLine Certifications

NAS
Network Administration Specialistuas
Ubiquiti Administration SpecialistUbiquiti UniFi
Ubiquiti airMAX
MAS
MikroTik Administration SpecialistNAE
Network Administration SpecialistMAE
MikroTik Administration EngineerSwitching & Bridging
Tunnels
Traffic control
Administration
Huawei
MAE
MikroTik Administration EngineerIPv6 protocol
Advanced Routing
- Security
-
CSE-HPP COMING SOON
Global vision of ethical hacking and penetration testing
-
SIA-HPP COMING SOON
Global vision of ethical hacking and penetration testing
-
SIN-NSI COMING SOON
Information Security Regulations How to implement?
Academy Xperts OnLine Certifications
Security
Cybersecurity
Informatic security
Security of the information
-
- Data Science
-
DS-PYT-INT COMING SOON
Introduction to Data Science with Python
-
SIA-HPP COMING SOON
Global vision of ethical hacking and penetration testing
-
SIN-NSI COMING SOON
Information Security Regulations How to implement?
Academy Xperts OnLine Certifications
Data Science
Python
Informatic security
Security of the information
-
- Microlabs
- What is MiikroLabs?
- (ML-001) Manage multiple IPs
- (ML-002) Public IPs to clients
- (ML-003) Failover, balancing, recursion
- (ML-004) Filter implementation strategies to restrict access to web pages with MikroTik
- (ML-005) Guide for Firewall configuration in MikroTik RouterOS
- (ML-006) Filtering threats: Firewall rules to protect the router from common attacks on the network
- (ML-007) Practical solutions to optimize network infrastructure: Subnetting strategies, Routing and NAT troubleshooting
- (ML-008) BGP as a routing protocol to advertise IPv4 resources to the Internet
- (ML-009) Forms of Delivery and Implementation of IPv6 in ISP Environments
- (ML-010) BGP as an Internal routing protocol in a routed network
- (ML-011) OSPF as an internal routing protocol
- (ML-012) Guide to start our first Firewall in IPv6
- (ML-013) Guide to building an Advanced Firewall in IPv6
- (ML-014) Wireguard in MikroTik RouterOS v7
- (ML-015) OSPFv3 as an internal routing protocol
- (ML-016) BGP over IPv6 as a routing protocol to advertise IPv6 resources to the Internet
- (ML-017) Implementation of mark-connection and mark-packet for QoS
- (ML-018) Implementation of Simple Queues in MikroTik RouterOS v7
-
ML-001
How to properly manage multiple public or private IPs on the edge router
-
ML-002
Ways to assign public IP addresses to clients with MikroTik
-
ML-003
Guide to configuring Internet egress routes with two or more providers (failover, balancing and recursion)
-
ML-004
Filter implementation strategies to restrict access to web pages with MikroTik
-
ML-005
Guide for Firewall configuration in MikroTik RouterOS
-
ML-006
Filtering threats: Firewall rules to protect the router from common network attacks
-
ML-007
Practical solutions to optimize network infrastructure: Subnetting strategies, Routing and NAT troubleshooting
-
ML-008
BGP as a routing protocol to advertise IPv4 resources to the Internet
-
ML-009
Forms of Delivery and Implementation of IPv6 in ISP Environments
-
ML-010
BGP as an Internal routing protocol in a routed network
-
ML-011
OSPF as an Internal routing protocol in a routed network
-
ML-012
Guide to start our first IPv6 Firewall
-
ML-013
Guide to building an Advanced Firewall in IPv6
-
ML-014
Wireguard in MikroTik RouterOS v7
-
ML-015
OSPFv3 Internal routing protocol
-
ML-016
BGP over IPv6 as a routing protocol to advertise IPv6 resources to the Internet
-
ML-017 new ! ...[5-April-2024]
Implementation of mark-connection and mark-packet for QoS
-
ML-018 new ! ...[20-April-2024]
Simple Queues in MikroTik RouterOS v7
- MikroTik
- Are you ready to take advantage of the MTCNA Certification Course?
- MTCNA, MikroTik Certified Network Associate Certification Course
- MTCTCE, MikroTik Certified Traffic Control Engineer Certification Course
- MTCWE, MikroTik Certified Wireless Engineer Certification Course
- MTCIPv6E, MikroTik Certified IPv6 Engineer Certification Course
- MTCUME, MikroTik Certified User Manager Engineer Certification Course
- MTCSE, MikroTik Certified Security Engineer Certification Course
- MTCRE, MikroTik Certified Routing Engineer Certification Course
- MTCINE, MikroTik Certified Inter Networking Engineer Certification Course
- MTCSWE, MikroTik Certified Switching Engineer Certification Course
- MTCOPS (MikroTik Certification Test Online Proctoring System)
MikroTik OnLine Certifications

- Blog/News
- Another resources
- Our shop
- Sign in

Headquarters
Av. Juan T. Marengo and J. Orrantia
Professional Center Building, Office 507
Guayaquil. Ecuador
Zip Code 090505
Subscribe
to our weekly newsletters
Certification Courses
NAS series
Network Administration Specialist
UAS Series
Ubiquiti Equipment Management Specialist
- UAS-UNI-CAD (WiFi network configuration and administration)
- UAS-UNI-PDE (Planning and Deployment of WiFi networks)
- UAS-AIR-INT (Intro to Ubiquiti airMAX)
- UAS-AIR-CPM (PtP and PtMP link configuration with Ubiquiti airMAX)
- UAS-AIR-FPD (Fundamentals, planning and deployment of radio links with Ubiquiti airMAX)
MAS Series
MikroTik Administration Specialist
NAE Series
Network Administration Engineer
MAE Series
MikroTik Administration Engineer
- MAE-SWI-BON (Bonding with RouterOS)
- MAE-SWI-VLN (VLANs with RouterOS)
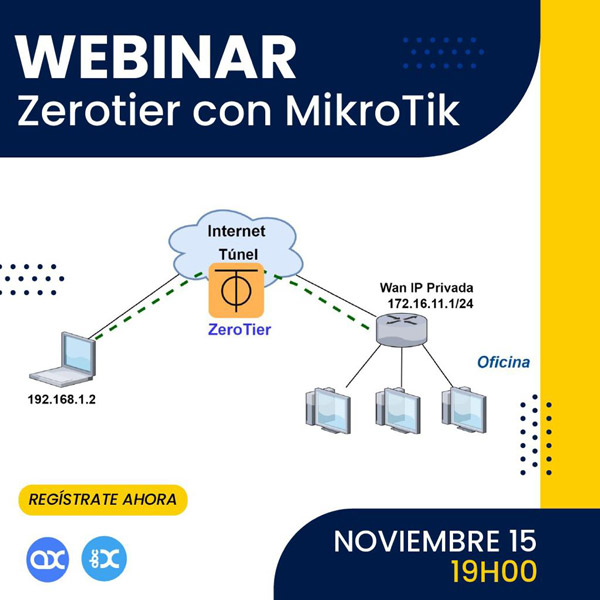
- MAE-VPN-ZET (MikroTik VPN with ZeroTier)
- MAE-VPN-PPP (PPP Tunnels)
- MAE-VPN-IPS (IPSec tunnels)
- MAE-CTT-QoS (Queuing Trees and Quality of Service (QoS)
- MAE-CTT-BCA (Load balancing)
- MAE-ADM-UMR (Introduction to UserManager & RADIUS)
- MAE-ADM-UMH (UserManager + HotSpot)
- MAE-IP6-ROS (Introduction to IPv6 with MikroTik)
- MAE-IP6-MED (IPv6 MikroTik, medium level)
- MAE-IP6-AVN (IPv6 MikroTik, advanced level)
- MAE-RAV-ROS (Introduction to Advanced Routing)
- MAE-RAV-VRP (VRRP with MikroTik)
- MAE-RAV-OSPF (OSPF MikroTik)
- MAE-RAV-BGP (BPG & MPLS MikroTik)
MikroTik Certifications
Security
Cybersecurity
-
CSE-PMI
Basis for prevention and mitigation -
CSE-HPP
Global overview of ethical hacking and penetration testing (coming soon)
Security of the information
-
SIN-NSI
Information security regulations How to implement? (soon)
Data Science
Python
-
DS-PYT-BAS
Python Fundamentals for Data Science -
DS-PYT-INT
Introduction to Data Science with Python
(coming soon)
Copyright © 2024 abcxperts.com – All Rights Reserved
Developed by Network Xperts SA